The solution is to use the Excel
FILTER function (not just the interactive filtering tools). FILTER is one of a new set of array functions, or 'spill' functions which operate on ranges and produce ranges - an amazing set of new tools.
Excel 365 and later or other
compatible spreadsheets will have these array functions.
Attached is an example of a reworked MasterTemplate which turns it into what I call a
Model Database, which is the way we'll be evolving Excel modeling in RDSS going forward. Here are 3 days from Santa Anita 2021 Jan 8,9,10. All races selected pacelines from those days are in the
All Sheet as usual. (Thanks to
gfnut for providing a recent set of data

)
The
Filter Examples Sheet does 2 things:
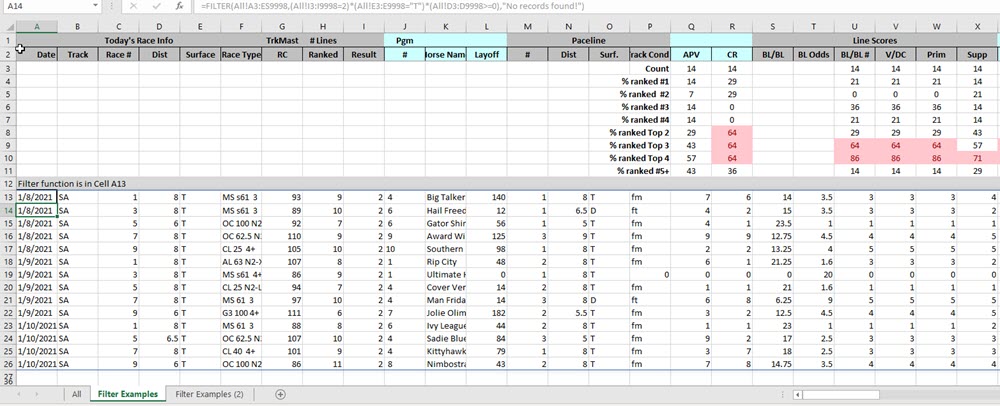
1. the Stats block is moved to the TOP, with data below it. Stats are done for Rows 3 - 9999 (i.e. ALL rows).
2. The data part is drawn by the
filter function in cell
A13, the first row of data, which references data in the All Sheet. No data is copied. The data returned from the result of the filter function 'spills' into the space around the cell where it is specified.
The
filter function specifies:
1. what is the source data (i.e. everything in the All Sheet)
2. filter conditions: in the example, 3 filter conditions are given (though you could have endless conditions) -
Result Col I = 1 (Winner),
Surface Col E = "D" (Dirt),
Distance Col D >= 0 (All distances)
If you change or add any filter conditions, or if you add NEW data to the ALL Sheet, the data automatically updates, as do the Stats.
If you wish to maintain regular queries for different sets of conditions, just create a copy of the Filter sheet and specify different conditions in each.
If you wish to maintain separate Excel Workbooks to draw on the same data, change your filter source to reference the All Sheet in the file which contains the data (rather than referencing the All sheet in the current workbook).
To use this example with your own data, simply copy your own All Sheet data into the All Sheet in this example, replacing the data in the example.
This setup can be made more ergonomic by far, but this gives an idea of how to make this simpler and get started with creative filtering. After that, add the SORT function to order the results in desired ways. This is where RDSS is headed with Excel modeling (including automatic appending of newly exported data to the All Sheet of your Model Database file). Etc ...
Here is the sample database:
Model.Database.xlsx
Again, you need a current version of Excel or a compatible spreadsheet to make the new FILTER function work. Google to find out whether your Excel version supports the new ARRAY functions (including FILTER) and consider updating if this tool seems useful.
If your Filter Examples screen looks something like this, your Excel version supports FILTER.
Here is one of my favourite websites for general Excel info, here, the FILTER function and how to use and specify it:
https://exceljet.net/excel-functions...ilter-function (although any Google search on 'excel filter function' will return many hits).
Enjoy!
Ted