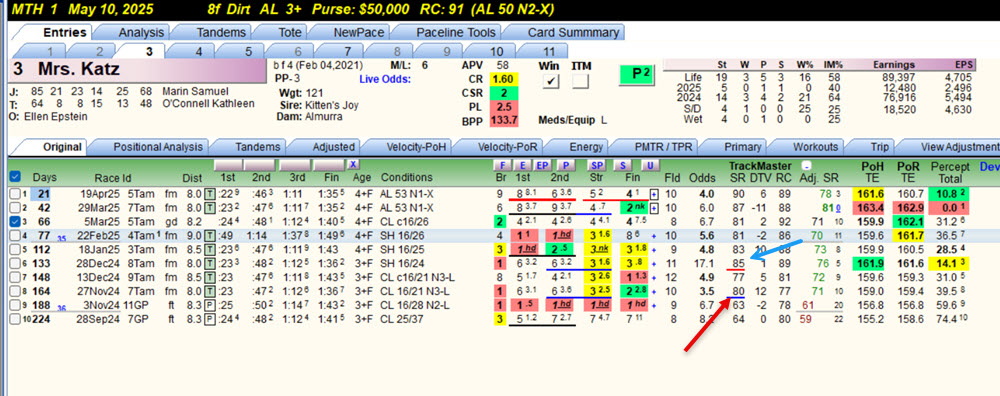
Watching Dave's videos (I know he has gone beyond these basics) I have learned that what this basic screen tells us, is looking at all the lines in the "shown" past performances, that there is a 90% chance that the horse will run between these two speed ratings in this race. Looking at the 3 horse Mrs. Katz, we expect her to run between an 80 and an 85 speed rating today.
There is a book out called, I believe,
How to Measure Anything. Statically, with 10 events if you take the 4th lowest, here 80, and the 3rd highest, here 85, there is a 90% statistical chance the horse will run between those two scores. You can see in her last two races she ran a 90 and an 87, so you can expect her to run to the upper limit of her expected range. Here is a look at all the horses in the race. Obviously, this is not exact. One needs to handicap the horse further. BUT, it is a look at the horses entire shown past performances and is a point of information for our handicapping. Watch how often this helps our decision making.
