Hello Brandon, welcome to Pace and Cap!
I do understand the distinction between the 2 methods of calculating 3rd Fraction which you describe:
Pizzolla’s PPF (Projected Power Fraction) versus
Lehane (which is the same as
Dr Sartin has described and used for years predating Lehane’s published works). In RDSS2, we display BOTH the Fraction 3 with 2nd call beaten lengths added back in, captioned PF3 (Projected Fraction 3), more out of curiosity and as a component of our Supplementary Factor ranking; AND the classical Fraction 3 calculation which only employs the leaders’ 3rd fraction time plus/minus lengths gained/lost. Both of them are normalized to today’s distance and adjusted by Daily Track and Inter-Track Variant.

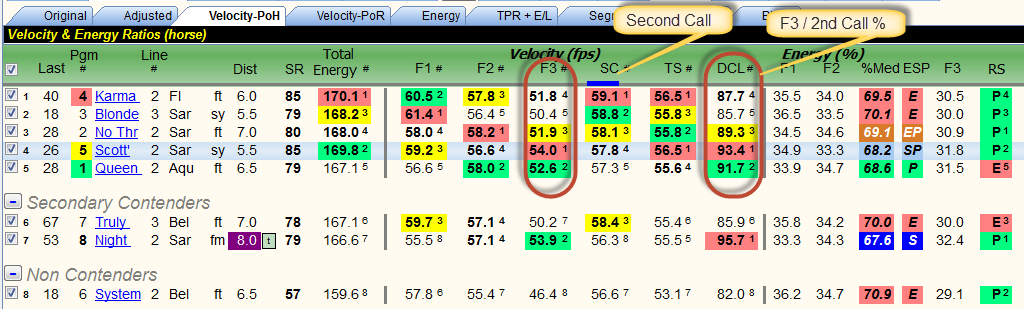
Note the difference in ranks from the above images, PF3 ranks (top) are
5-4-1-3-2 versus F3 ranks (2nd image)
5-1-2-4-3.
The 3rd fraction (F3) is an important segment of the race, but it can
never be predictive on its own, regardless of formulation. 99% of horses decelerate from the 2nd call to the finish line (F3) and the slower they were going to the 2nd call, the less they will typically slow down during F3. That’s why we typically see an
inverse relationship between relative
2nd call rankings and the simple
Deceleration ratio (F3 / 2nd Call) represented by the DCL column above (2nd image).
I like to see a representation of horses’ F3 performances (compared to each other) expressed relative to how fast they were travelling during each of the prior race segments, also tempered by overall final time speed. I use the
V/DC calculation (Velocity relative to Deceleration) to track this relative measurement of what horses have left to exert during F3 in relationship to what they had to exert during the
1st and 2nd fractions.
The foregoing F3 component is based on the ‘classical’ F3 computation, the one you and Lehane compute. I added the PF3 alternate to RDSS2 (from requests) and do try to track whether there is a long-term significant difference using that treatment of F3 energy. Unfortunately, I do not actually have longitudinal comparative studies to cite, but my anecdotal opinion from working a whole lot of races and observing the PF3 (PPF) ranking of Fraction 3 – is that, like much of the lower level detailed measurements in race analysis, the significance is
variable. Sometimes in some races, in some race matchups, PF3 ranks the eventual winner higher than classical F3 – while in other races, it is worse, or identical. Perhaps there are indeed specific circumstances (i.e. specific types of pace matchups, or certain surfaces or distance structures) where PF3 gives a consistently better measurement of how a horse will decelerate in F3 compared to its opponents – and if there are, I would love to have that information.
My suspicion is that if you chose one method or the other, and used it in concert with other measurements of race segmental analysis – over a large number of races they would produce
about the same rankings in one’s line scores (= odds line). More importantly, to me: will one F3 measurement or the other provide different enough rankings of horses that it affects who I choose to bet on and the value I get in those betting scenarios - and over the long term, not just one race, which is the final proof of the usefulness of any handicapping analysis.
It would be fascinating to work a few races (though only a few races won’t tell the tale) and study the relative differences between F3 and PF3 to see if any situational use can be made of PF3 over the classical F3 used throughout Sartin factor analysis and in the compounding of factors.
If you would care to suggest a few current races, and provide your relative assessment of contenders identified differently by each method, perhaps I and others can chime in as well.
Thanks for the stimulating idea,
Best wishes!
Ted