Hi Joe, and welcome!
Pace of Horse (PoH) is the Pace of the Race (PoR) plus/minus lengths gained/lost during each race segment. PoR is a short-hand for the times set by the front-runner at each call point of the race (Call1, Call2 Finish). Thus, a gate-to-wire winner will have the same PoH and PoR numbers: the horse WAS the Pace of the Race.
Total Energy (TE), when not otherwise qualified, refers to the Total Energy of the Horse: the sum of the 3 fractional velocities of the horse itself (F1+F2+F3 velocity = Total Energy; i.e. the velocities of the horse itself, adjusted for lengths gained/lost). We show 2 Velocity screens: PoH and PoR - and the difference between the 2 is that the Horse (PoH) is adjusted for beaten lengths gained/lost while the PoR screen shows the velocity resulting from measuring the running times of the front runner at each point.
It is important to note when a horse has faced a fast PoR (perhaps the fastest it has ever, or recently, faced). If the horse shows a credible run against such a fast pace, closing steadily, finishing in the money or up close at one or more points, you can also infer that it is in some kind of shape (of course, facing a healthy PoR in tis recent races is all relative to what PoR's
other horses have faced too). You see the PoR shown to the right of the Original Screen, and on the PoR Velocity screen.
Otherwise, all Total Energy (TE) readouts are the Total Energy of the
horse itself, and are ALL identical - they do NOT differ over the different screens.
Please consider these screens:
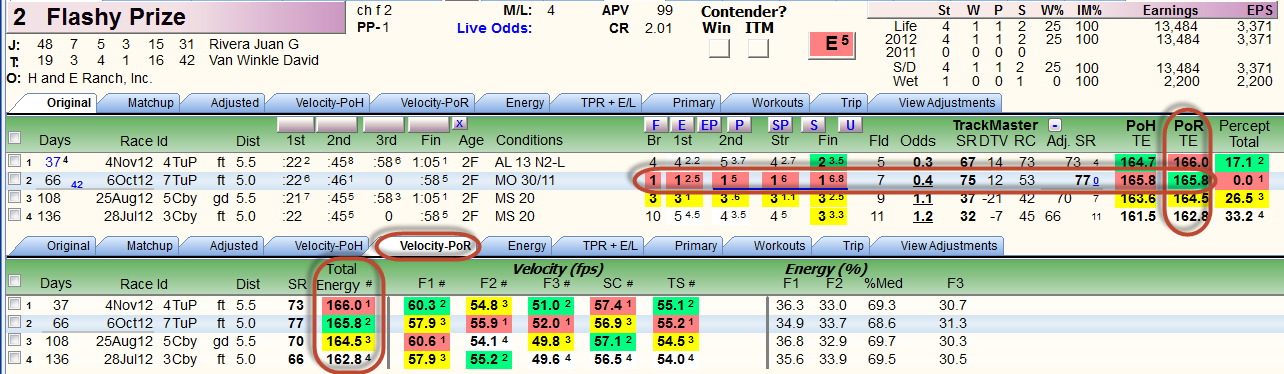

The PoR and PoH Total Energy are summarized at the right side of the Original screen, but are otherwise drawn from the respective Velocity screens (and you can see how Total Energy = the sum of the F1+F2+F3 velocity numbers). Note how the gate-to-wire 2nd race of the horse: the PoR and PoH Total Energy numbers (and fractional velocities) are identical - it WAS the pace of the race.
Total Energy (for the horse) appears on many different screens, because it is an important relative measurement of that race's strength. It is identical on all screens (TE differs only when we're talking about Total Energy of the race, not the horse, i.e. Pace of Race).
You asked about why the Final Segments panel (right-most one, labelled TS+F3) does not match Total Energy. That panel shows (as captioned) the average of True Speed (average velocity from beginning to end) and F3 (Fraction 3 velocity). The answer is: that panel is weighted by the
3rd fraction performance of the horse. We not only want to see the final time speed (i.e. speed rating) of the horse, we want to know, relatively, how much of it they disburse in the run from the 2nd call point to the finish line (where it counts).
Consider the following screens:
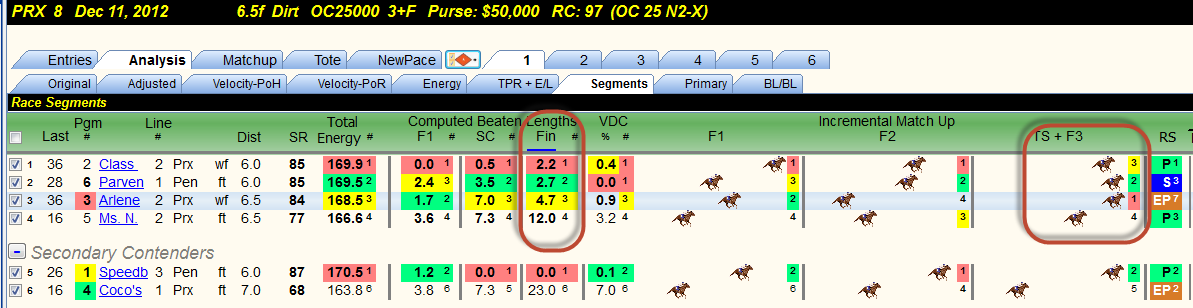

On the Segments screen, Beaten Lengths at the Finish, this measure is identical to True Speed (average velocity from beginning to end, as shown on the Velocity screen TS column = same thing). The top 3 horses rank 2-6-3 on Final/TS (the natural sort of the Segments screen) yet 3-6-2 on TS+F3 - SO, the difference must be the mixing in of the F3 velocity. And when we look at the Velocity screen (below the Segments screen image) we indeed see that the F3 rank is 3-6-2, so the additional weighting of the F3 component of that final Segments panel - in this instance - tips the ranking toward F3.
Here is how the race ran:

Hope this explains the inter-relationships between some of the screens. We have not discussed here how the line score of the various compound factors are weighted in the BL/BL screen (Bottom Line/Betting Line - the Line Score). And on that BL/BL screen (shown next post), the Winner #6 is shown effectively co-equal to the #2 (and superior to the heavy favourite #3), thus at the odds, a natural bet somehow.
Any questions, fire away!
Ted